Data visualization
Decoupling economic growth from resource and energy use, requires understanding how the individual components operate, but above all, it asks for oversight of how individual elements interact and work together to deliver a diverse set of services to society.
By mapping out the flows and stocks of a country, the focus shifts from environmental issues and short-term priorities to the performance of the overall system and “the development of an integrated development perspective that includes all levels and sectors”.
Mapping out flows and stocks is like looking at a jurisdiction as a ‘metabolism’. This is the new paradigm for understanding resource efficiency and the underlying causes of environmental issues in countries, cities, regions and organisations.
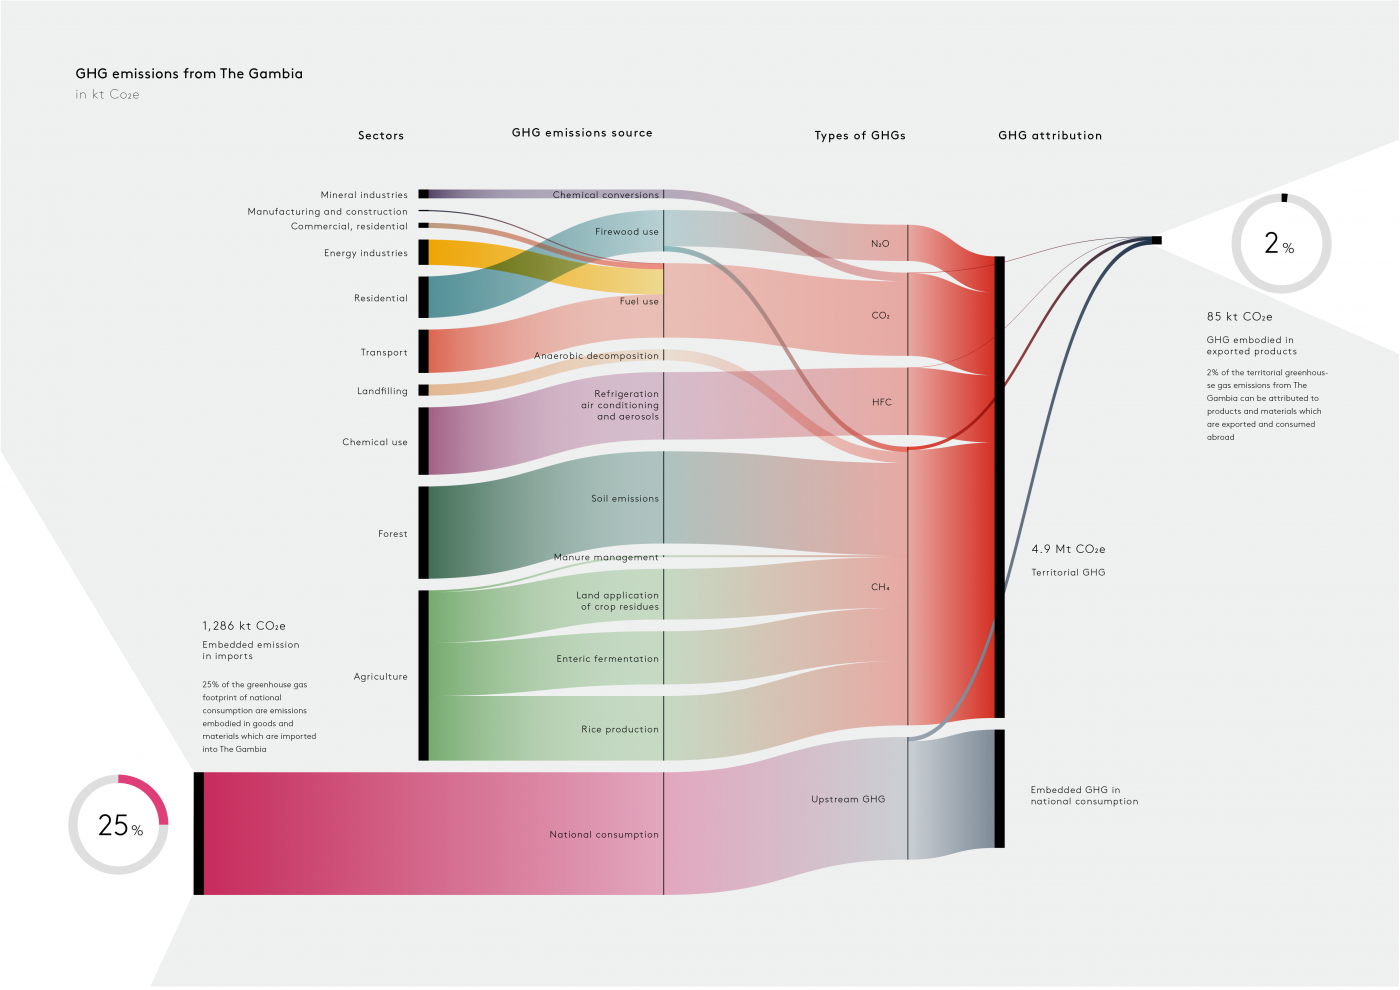
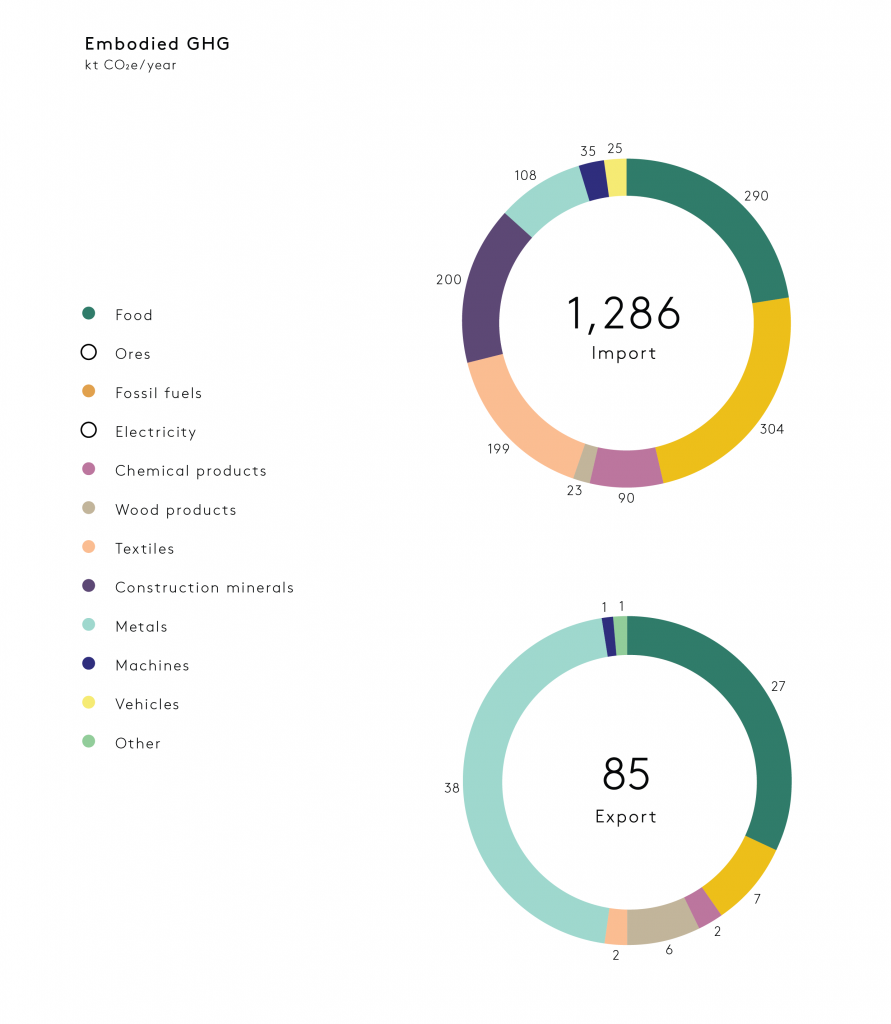
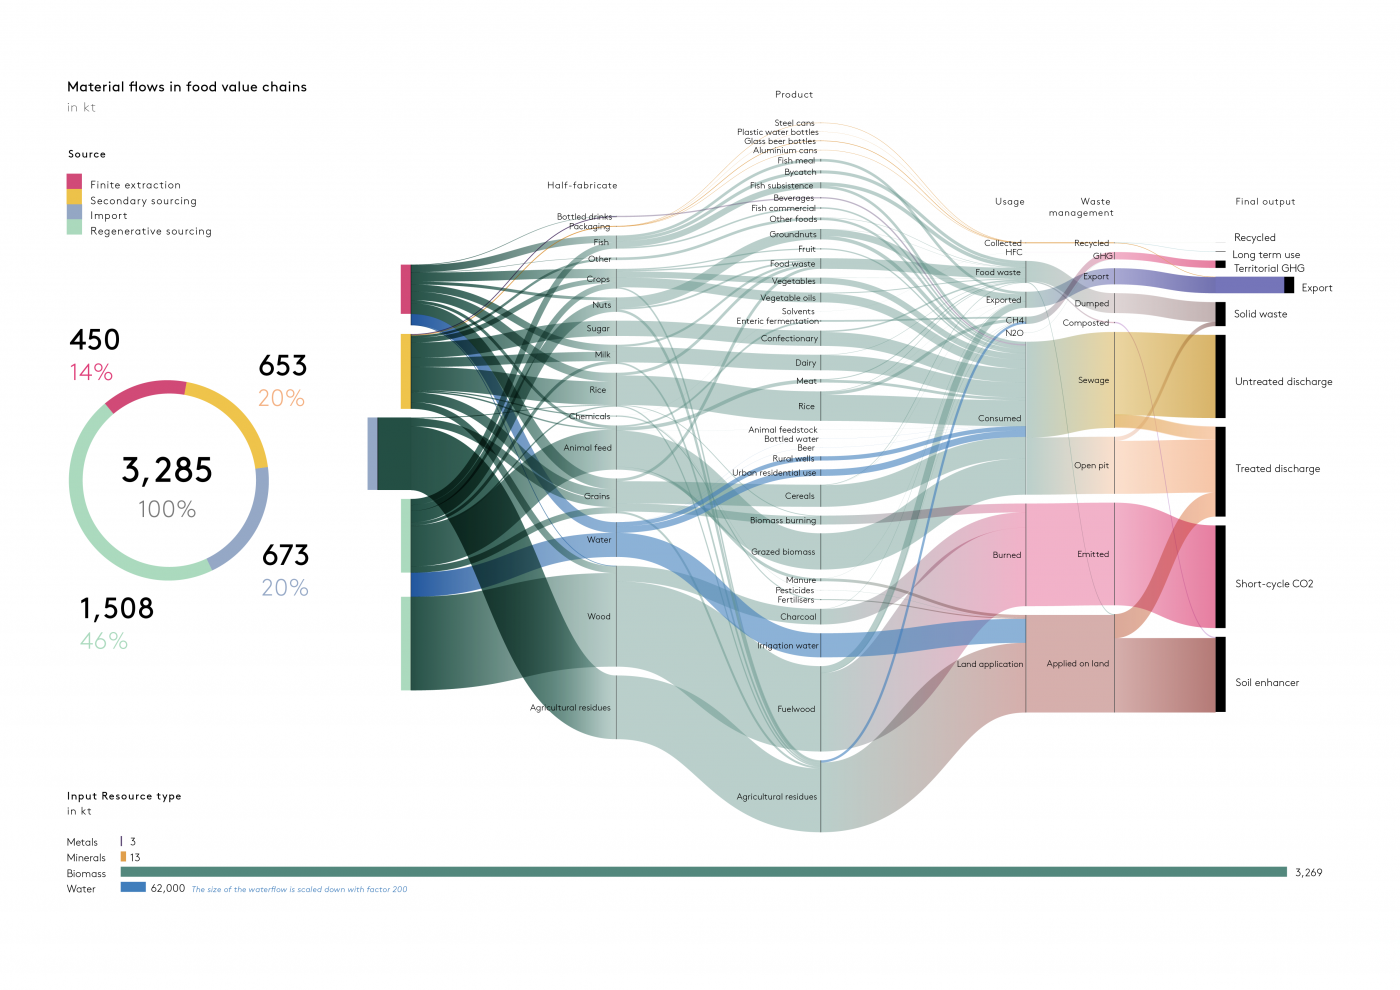
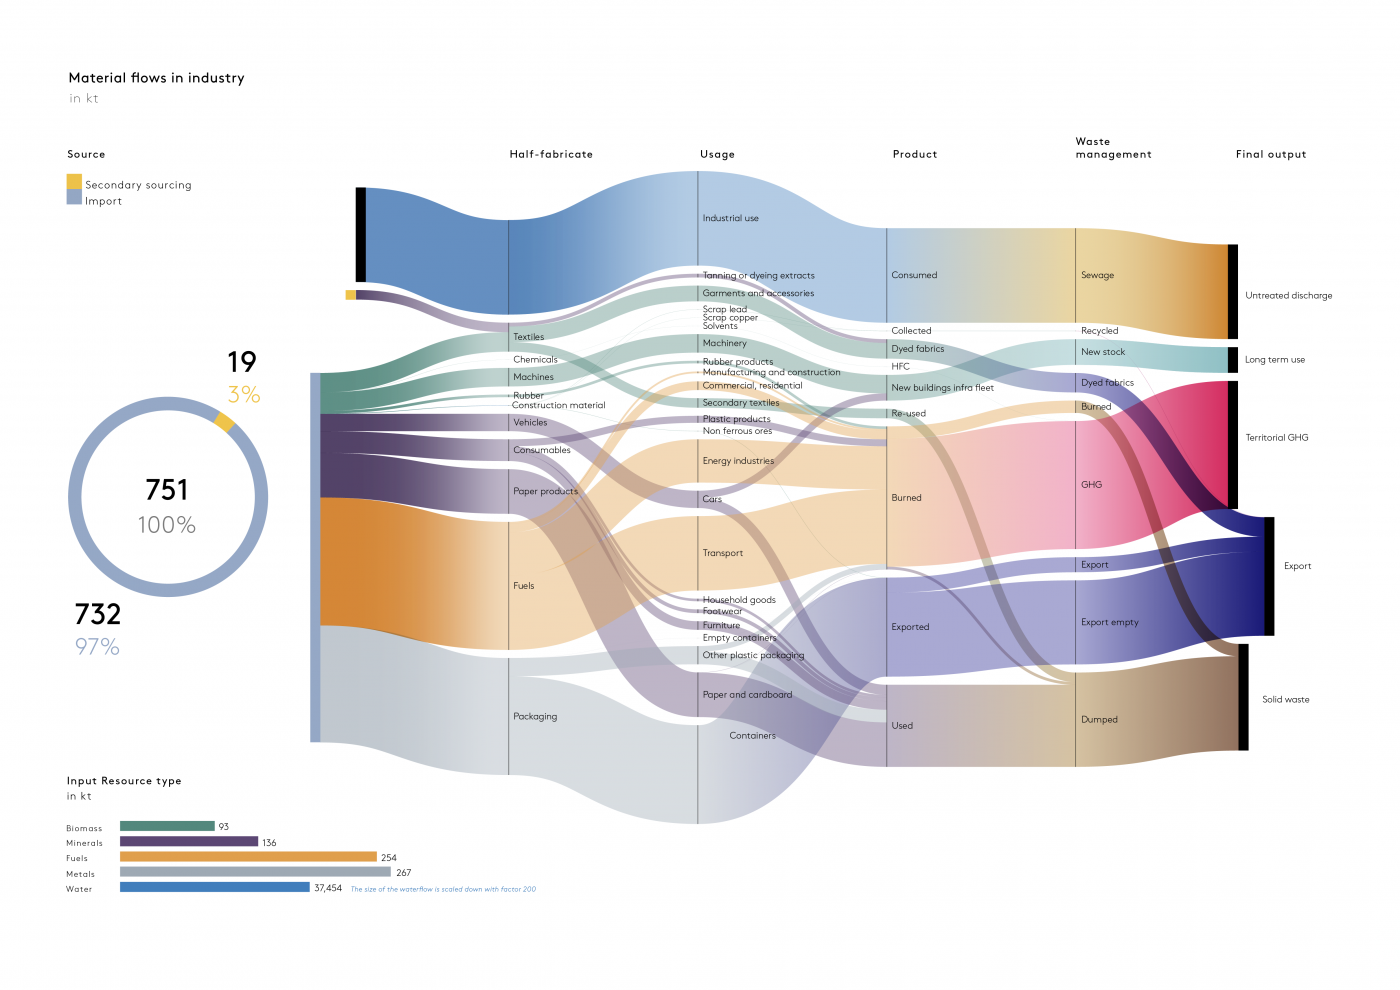
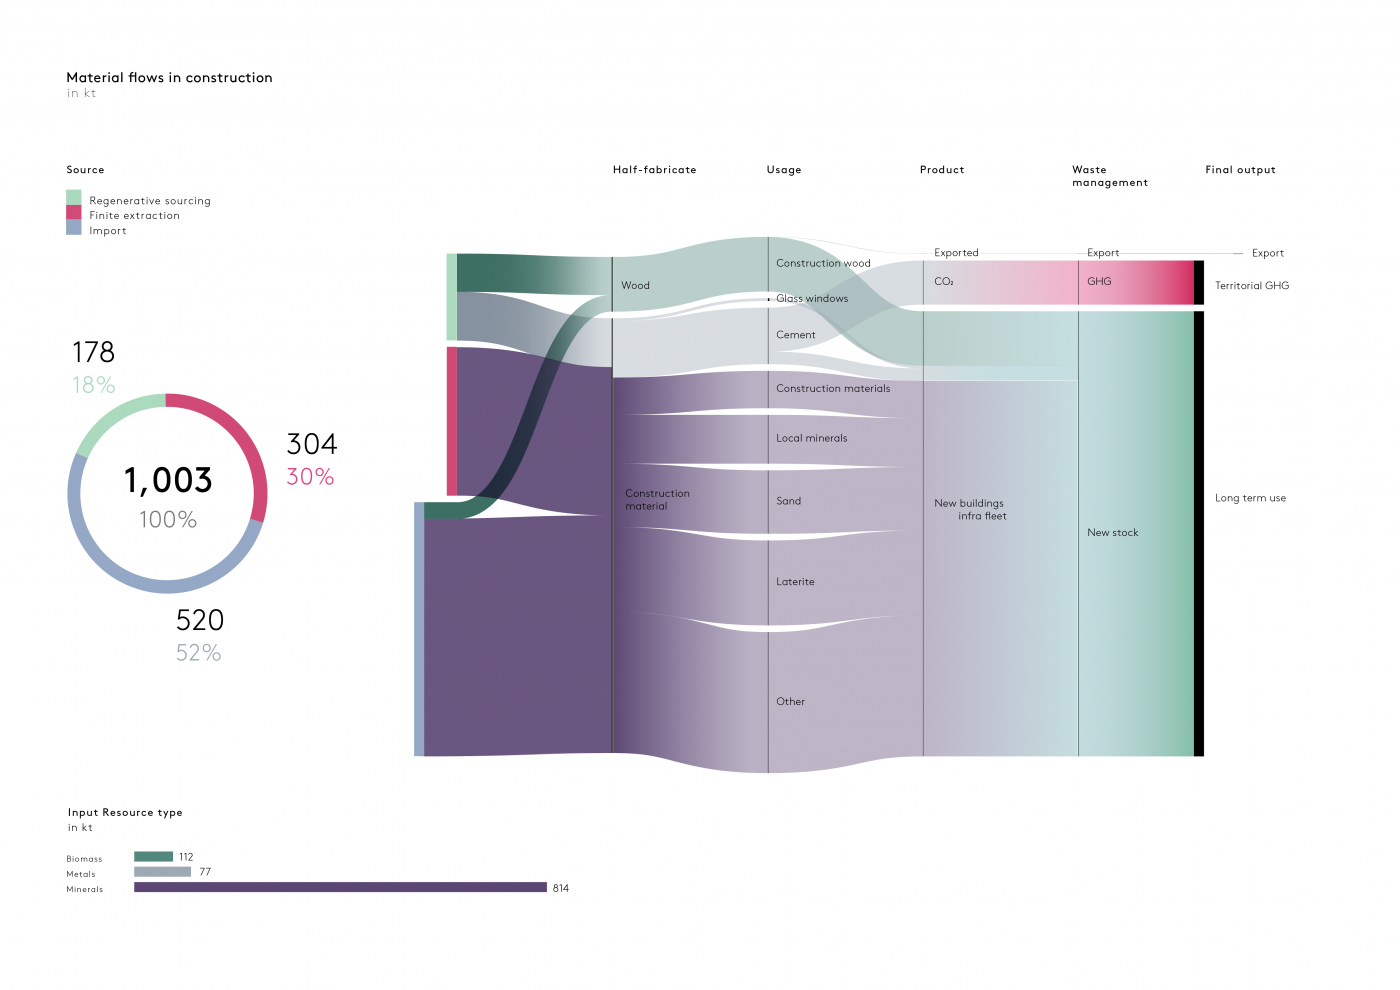
Data visualization is an effective means to help stakeholders develop a consensus on the current situation, and from there explore the challenges and opportunities. This article gives an overview of the visuals which haven been used in The Gambia to allow stakeholders identify the most promising opportunities themselves.
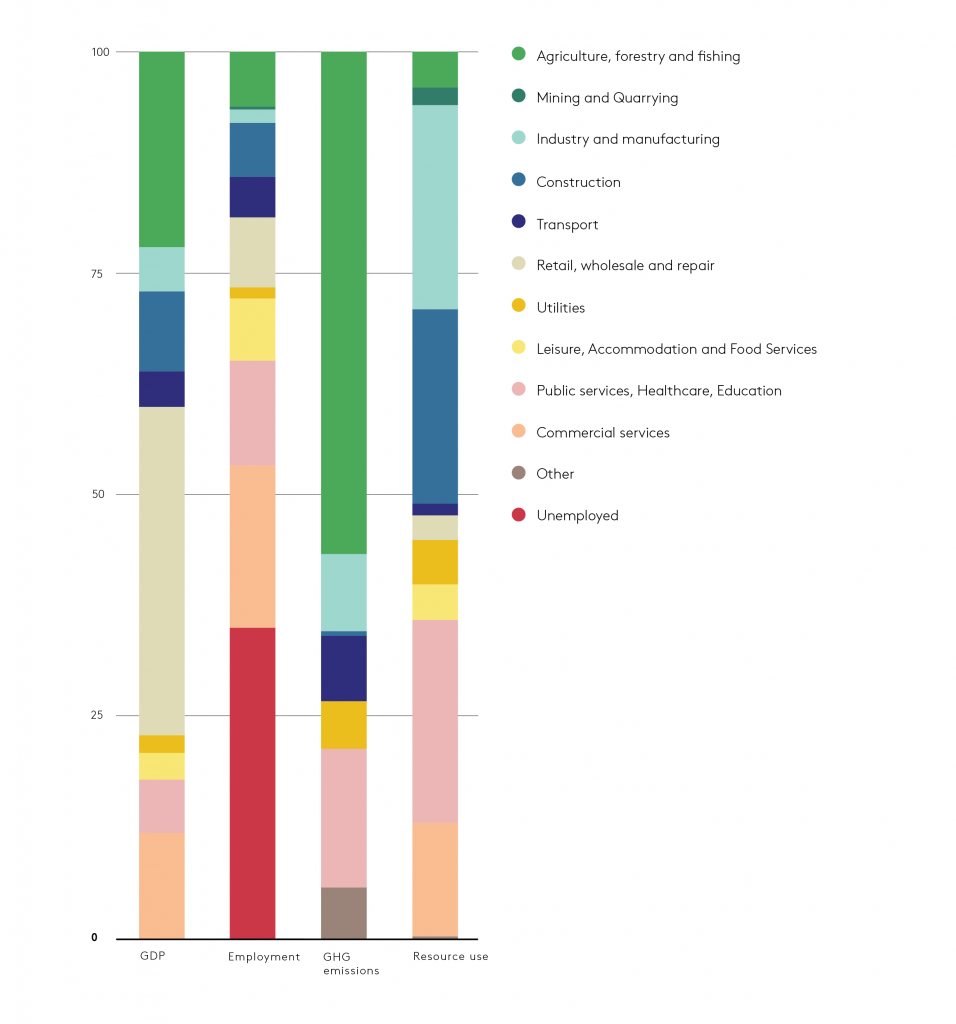
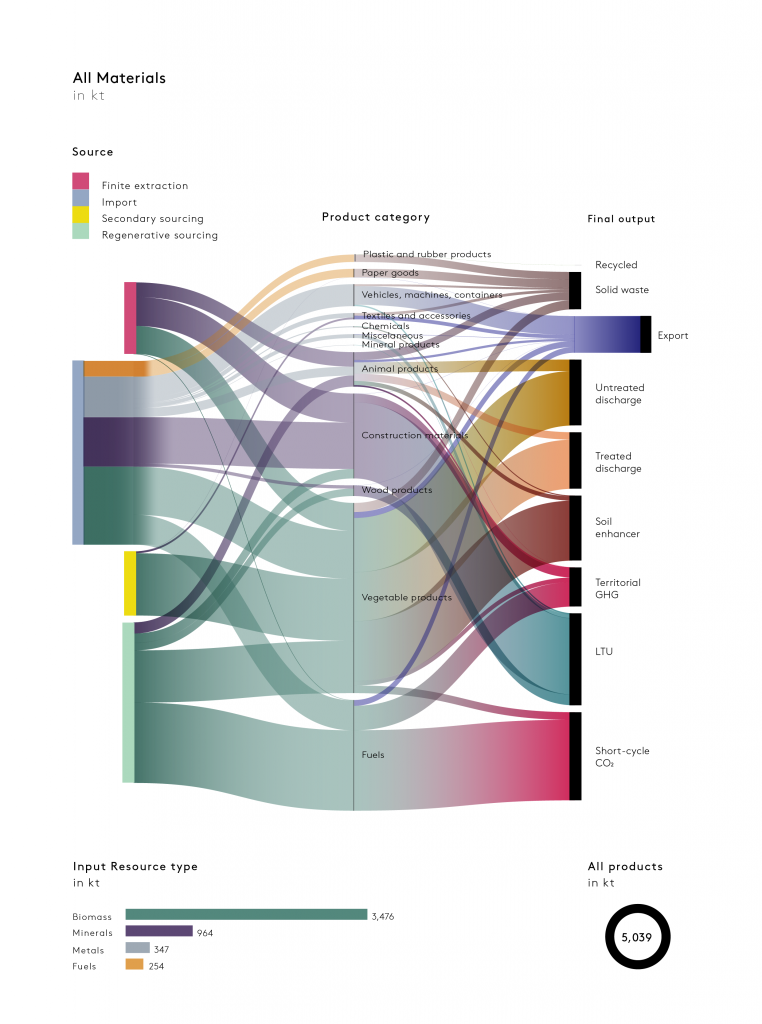
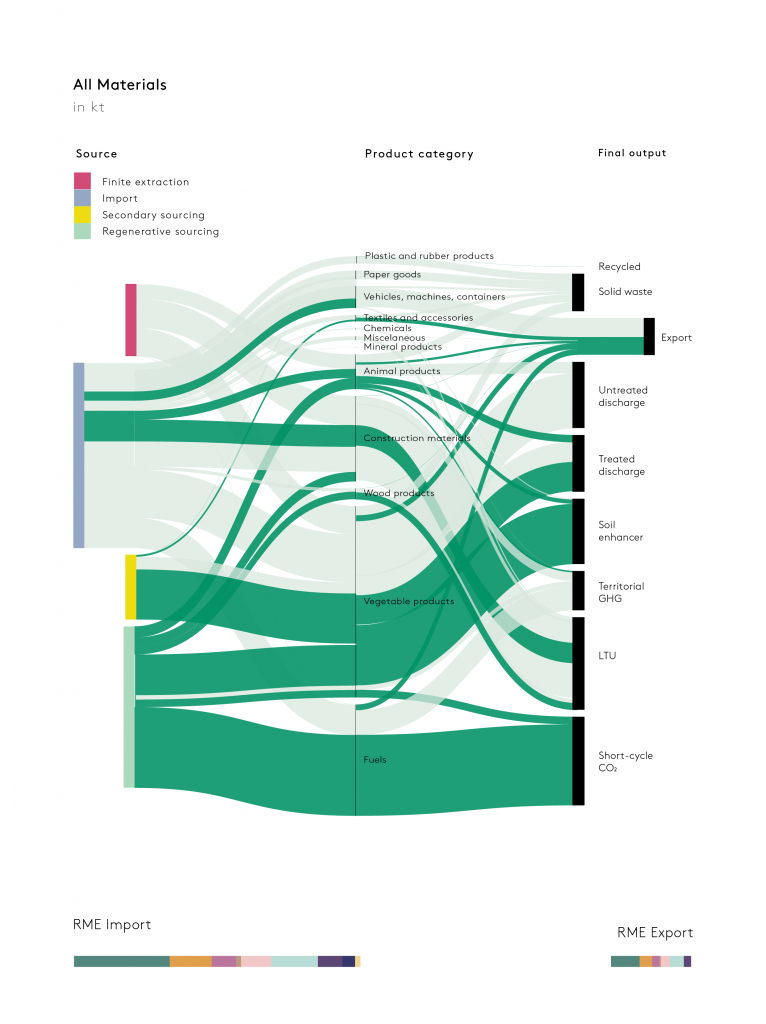
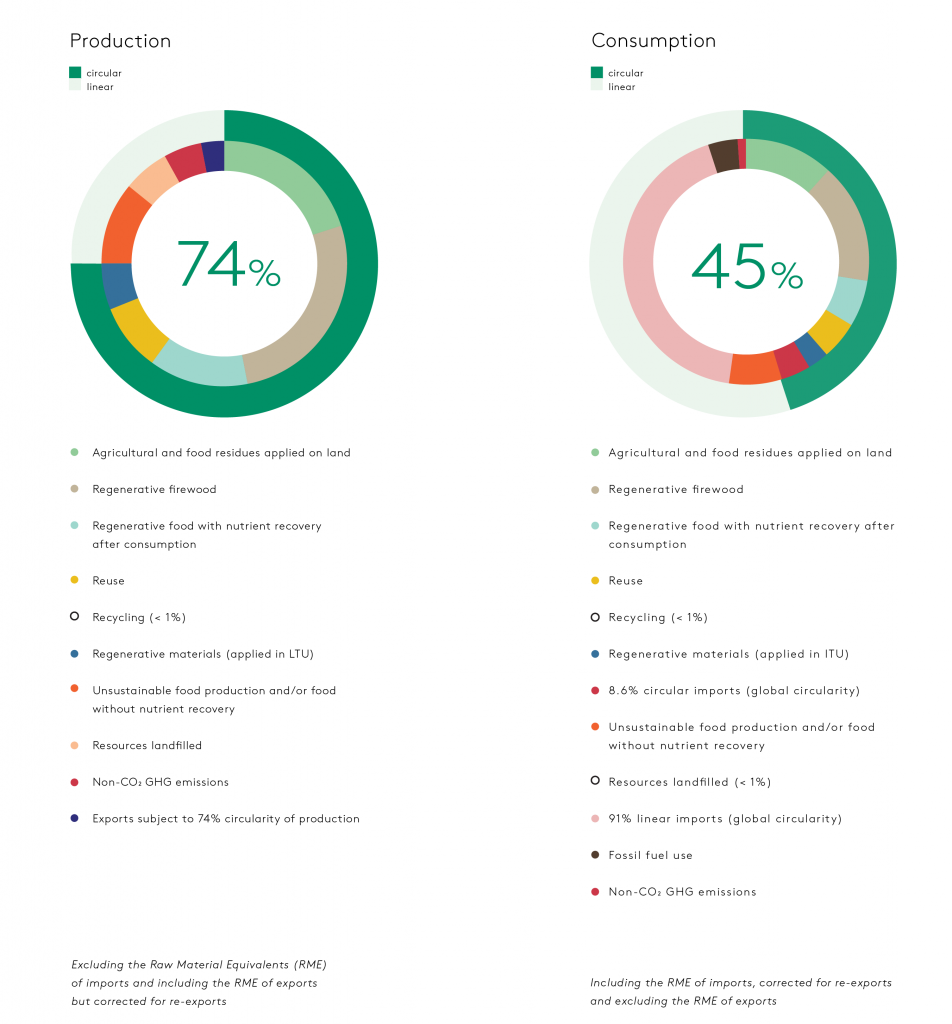
In the reporting, they help develop an understanding of how The Gambia uses material resources to fulfil certain societal needs, provide employment and a source of income for its people. They also show how the ‘world of materials’ relates to the world of ‘greenhouse gas emissions’, or rather how the circular economy can contribute to getting back on track to a world below 1.5 degrees Celsius global warming.
Visuals for The Gambia
This section provides an overview of the visuals which were developed as part of the metabolic analysis for The Gambia.